A Kronos forecast isn't one line pointing up or down. It's a spread of possible futures, and most of what's useful is in that spread. This post goes through each part of the QuantX402 window and the plain-English breakdown, using one real example.
Update, Oct 12 2026 (model status): we have since backtested the raw Kronos-small output over many past windows. It is not calibrated: the raw model showed no reliable directional edge, its raw 80% band was much too narrow, and its raw share of paths finishing higher overstated confidence. QuantX402 now treats the output as an experimental model signal: the range is re-centred and widened to match historical volatility, no move estimate is published, and raw path shares are being replaced by a direction plus a confidence bucket. Every forecast is scored in the free, public track record. The single example below is kept for illustration only.
The chart, layer by layer
On quantx402.app, the forecast is drawn on top of real BTC or ETH hourly candles:
| What you see | What it is | Field |
|---|---|---|
| Candles | Real hourly prices from Coinbase. Only closed candles go into the model | last_close, as_of |
| 30 faint lines | 30 futures Kronos-small sampled from the last 360 candles, 24 hours ahead | sampling.paths |
| Bold line | The median path: at each hour, the middle of the 30 paths. It's the center of the spread, not a promise | expected_move_pct (final step) |
| Inner band | Where half the paths are (25th–75th percentile) | percentiles.p25, p75 |
| Outer band | Where 80% of the paths are (10th–90th percentile) | band_80_pct, expected_range |
| Dashed line | Invalidation: the price that says "the model was wrong" | invalidation_level |
The breakdown panel, field by field
- Direction.
UPif at least 60% of paths end above the last close,DOWNif 40% or fewer,NEUTRALin between. - Paths finishing higher (
prob_up, raw). The share of the 30 paths that end higher. With 30 paths it moves in steps of about 3.3%. It's a count of the model's own samples, not a probability, and our backtest found it overconfident. It is being replaced by a direction plus confidence bucket. - Expected range (
band_80_pct,expected_range). The raw 10th to 90th percentile of where paths end was much too narrow, so the range is being re-centred on the last close and widened to match historical volatility. Treat it as a volatility-based range, not a calibrated 80% interval. - Invalidation level. For an UP view, the 10th percentile of path lows. For a DOWN view, the 90th percentile of path highs. For NEUTRAL there isn't one (
null). If price goes through it, the view was wrong. A forecast that never tells you when it's wrong can't be checked. - Strike view (
p_close_above). The raw share of paths ending above nearby round-number strikes. It is not odds, so don't read a gap against a prediction-market "BTC above $X" contract as an edge. It's information, not a recommendation. Prediction markets have their own rules and access limits depending on where you live. - Confidence and disagreement.
MEDIUMwhen the raw path share is at least 30 points from 50/50, otherwiseLOW.HIGHis switched off, and stays off while the model is uncalibrated.band_calibrated: falseandcalibration_notesay so in every response.
One real example: two models, two answers
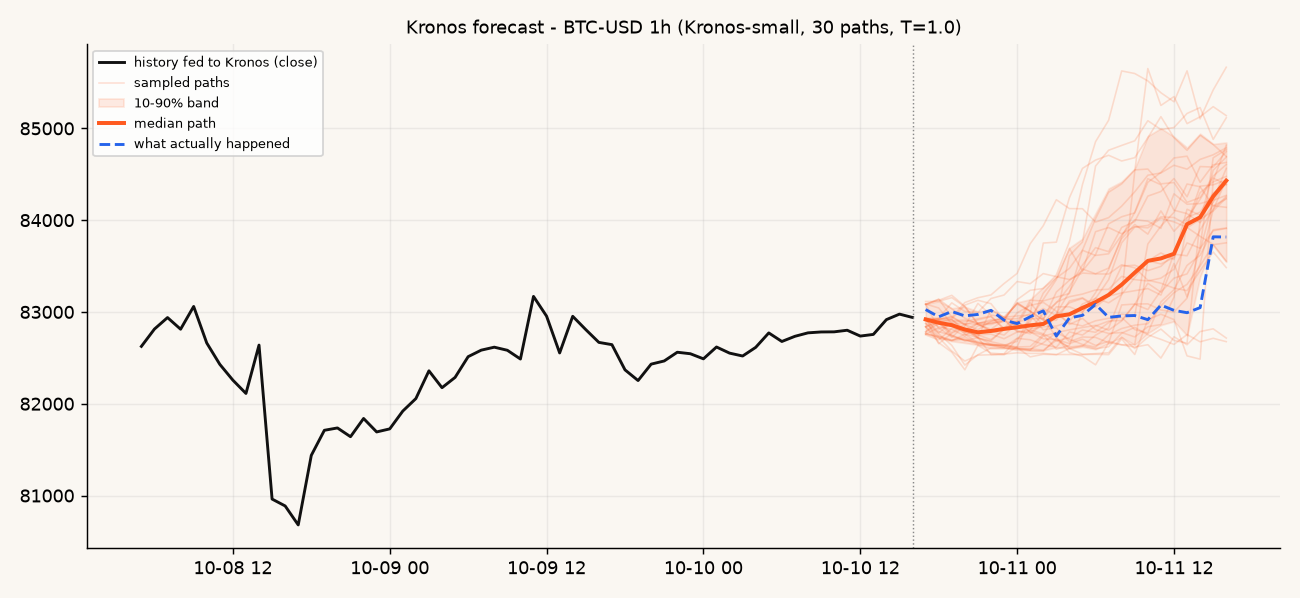
This is one example, not a benchmark, and the backtest above shows why one example says little. BTC-USD hourly candles, forecasting from Oct 10 16:00 to Oct 11 16:00 UTC. BTC started the window at about 82,940 and closed it at about 83,816, a move of roughly +1.06%.
Kronos-small:
- median path: +1.80%
- 93% of 30 paths ended higher
- 80% band: +0.73% to +2.30%
- Result: direction right, and the actual close landed inside the band. The median overshot.
Kronos-mini, same candles:
- median path: −0.48%
- 17% of paths ended higher
- Result: direction wrong, and the actual close landed outside its band.
What to take from it
- Don't read much into one window. Kronos-small's band held the outcome here, but across many windows the raw band missed far more often than an 80% band should. The median overshot too.
- Model size and settings change the answer. Two Kronos models looked at the same candles and disagreed on direction. In our lab runs, lower sampling temperatures also made bands narrower and more one-sided. If two reasonable setups disagree, the right output is "low confidence".
- One right call proves nothing. Neither does one miss. That's why QuantX402 scores every forecast after its window closes and publishes the track record, misses included.
Using this in an agent
A sensible agent treats the fact list as input to research, not an instruction. Some ways to do that:
- Skip or downweight anything with
confidence: "LOW"ordirection: "NEUTRAL". - Compare
band_80_pctwithhist_vol_over_horizon_pct. A band much narrower than recent volatility means the model is probably overconfident. - Keep the
invalidation_levelwith any decision you log, so you can check later. - Check
as_ofandstaleso you know which candle the forecast ran on.
Try it on the free delayed sample: GET https://quantx402.app/api/v1/sample?symbol=BTC-USD&tf=1h. The live forecast is /api/v1/forecast, $0.02 per call via x402 (live in USDC on Base and Solana mainnet).
Kronos is an open-source (MIT) model by its original authors; QuantX402 is not affiliated with them. Experimental model output for research and education only: informational, not financial advice. Past results don't predict future results.